The old GvR quote still holds: If you want your code to
run faster, you should probably just use PyPy.
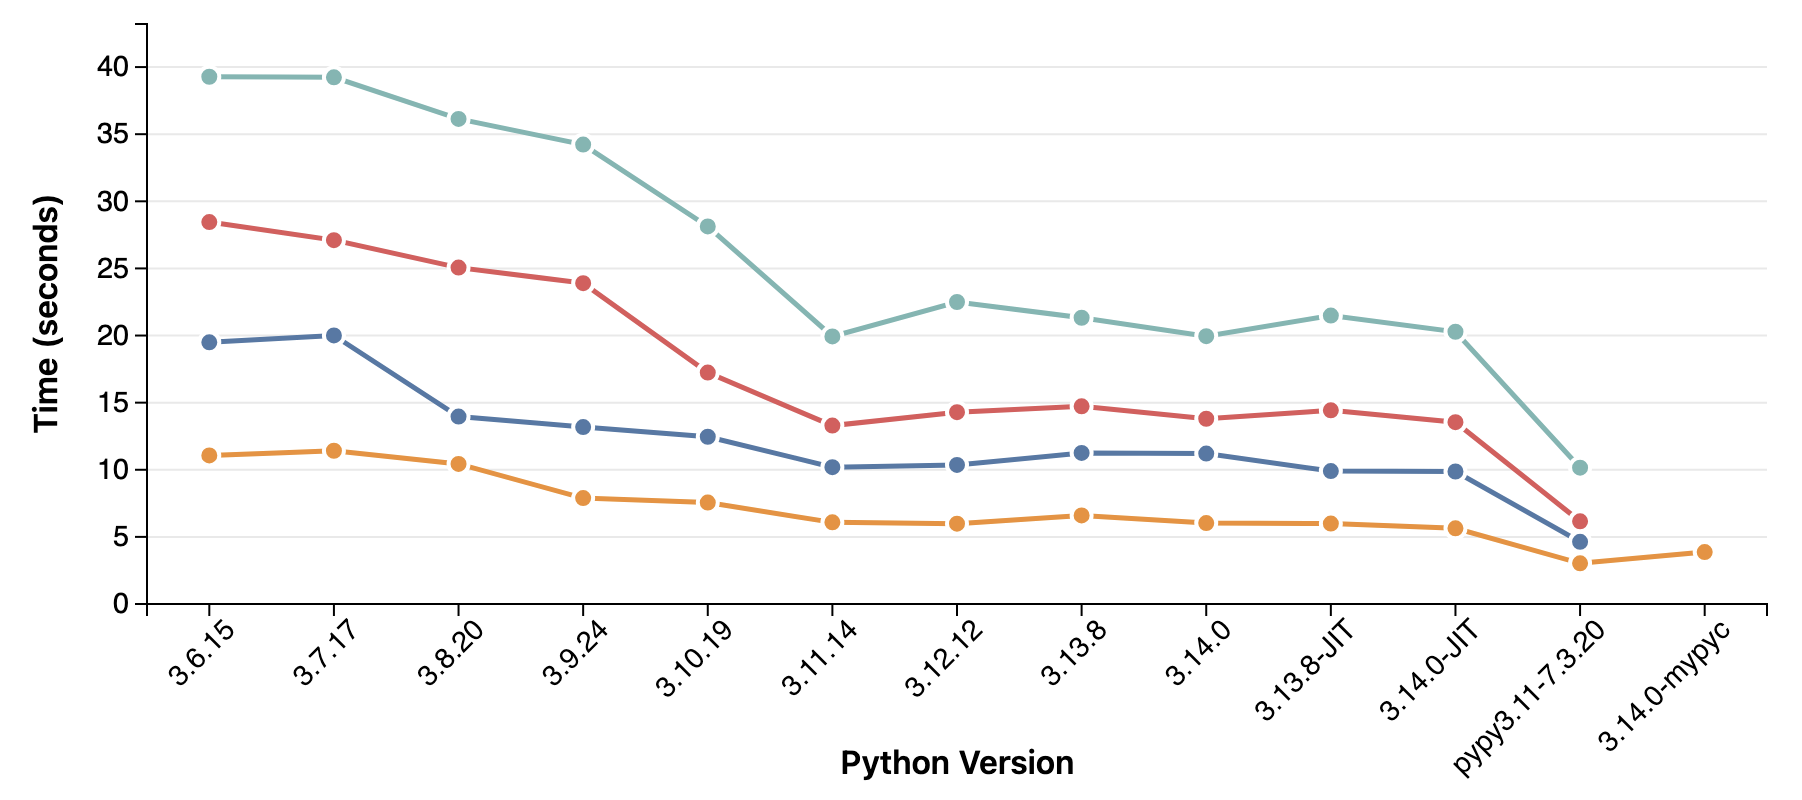
For my serialization library, the
performance improved a lot between 3.6 and 3.11, but since then it has mostly stayed the same.
PyPy provides a massive boost, and so does
compiling to C with MyPyC.
It will be interesting to see if the suggested
15% boost in 3.15 applies to my use-case.
After a tiny fumble and a hefty screen-repair quote, I recently found myself upgraded from an M1 Macbook Air to a M5 MacBook Pro. Since Python is what I do a large part of my working days, I thought it might be interesting to get some hard numbers on how performance has improved on that front. I already had a cross-python-version-benchmark going for my Knave-library, so it seemed sensible to add a CPU dimension to it and get two comparisons axis in one page.
I saw nice performance improvements in cPython between 3.7 and 3.11, but the last three releases has not brought as much. On the CPU side, performance does continue to march ever upwards. In my tests, the M5 is almost twice as fast as the M1. The Ryzen and Xeon (AWS t3.medium) can't keep up, but are included as reference points in the test. A more recent Xeon or Ryzen would hopefully do a better job!
Source is not publicly available for Knave. I hope the numbers are interesting enough on their own.
One of my side projects is Knave, a pure-Python library for consuming and producing files in a proprietary, typed and slightly crazy CSV dialect called "etab" or "ETables". It must run on old RedHat versions in tightly locked down environments, so it needs to be strictly zero dependency and very forgiving about out-of-support Python versions. This makes Knave a good candidate for cross-version testing!
The test uses Knave API to generate a 1,000,000 row in-memory etable with 6 columns of different types (AbsTime, RelTime, bool, int, str). This table is then written to disk and read back using a streaming reader. Timings are taken for each step and for the total process runtime both inside interpreter and E2E from the shell.
Knave is a small library. About 2000 lines of code for the core, excluding tests and utilities like the structure-aware diff-tool.
The biggest single performance bottleneck comes from the row/column splitting logic in the reader. The Python csv-library is faster than my pure Python code, but it only takes me 90% of the way to perfectly handling all known corner cases found in etab files out in the wild. With an elaborate csv-dialect and some clever inspections and fallback paths I could maybe use csv-lib for almost all lines of almost all files and still maintain perfect compatibility... But I'm not sure the performance gain is worth the hassle.
Another interesting bottleneck is in the de-/serialization of individual fields. In particular
on the deserialization side there are some trickery with handling the various legal representations of
null (void "void", "vOiD" etc.), per-column default values to be used in place of null,
nonstandard escape-characters and all the native data types of course. Each problem is
simple and computationally cheap, but the volume of function calls and variable dereferences
add up.
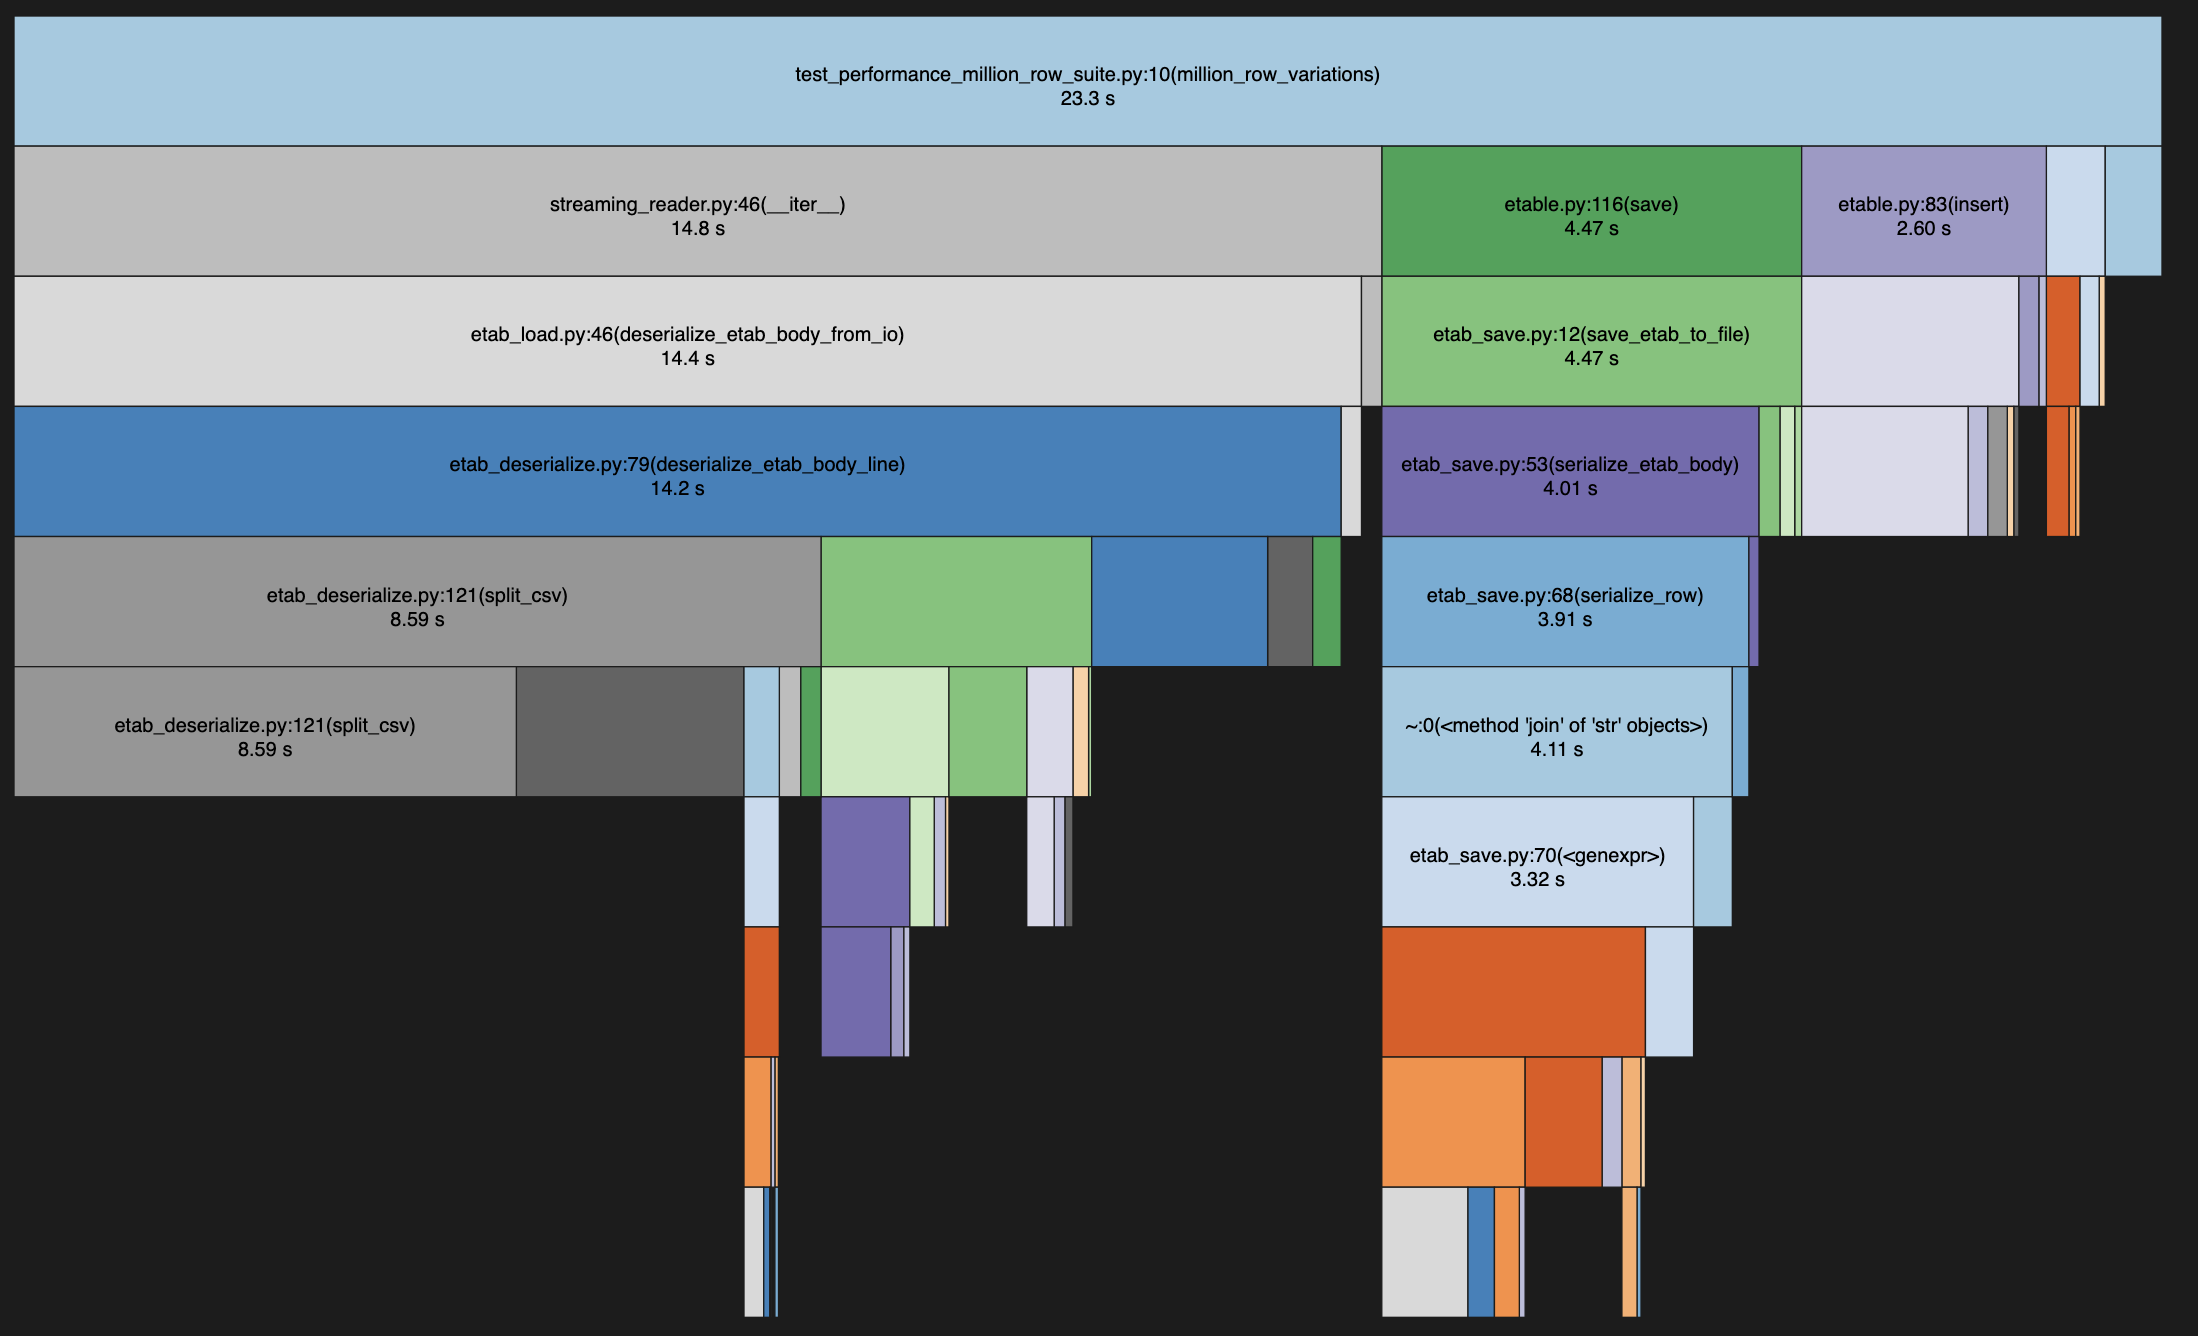
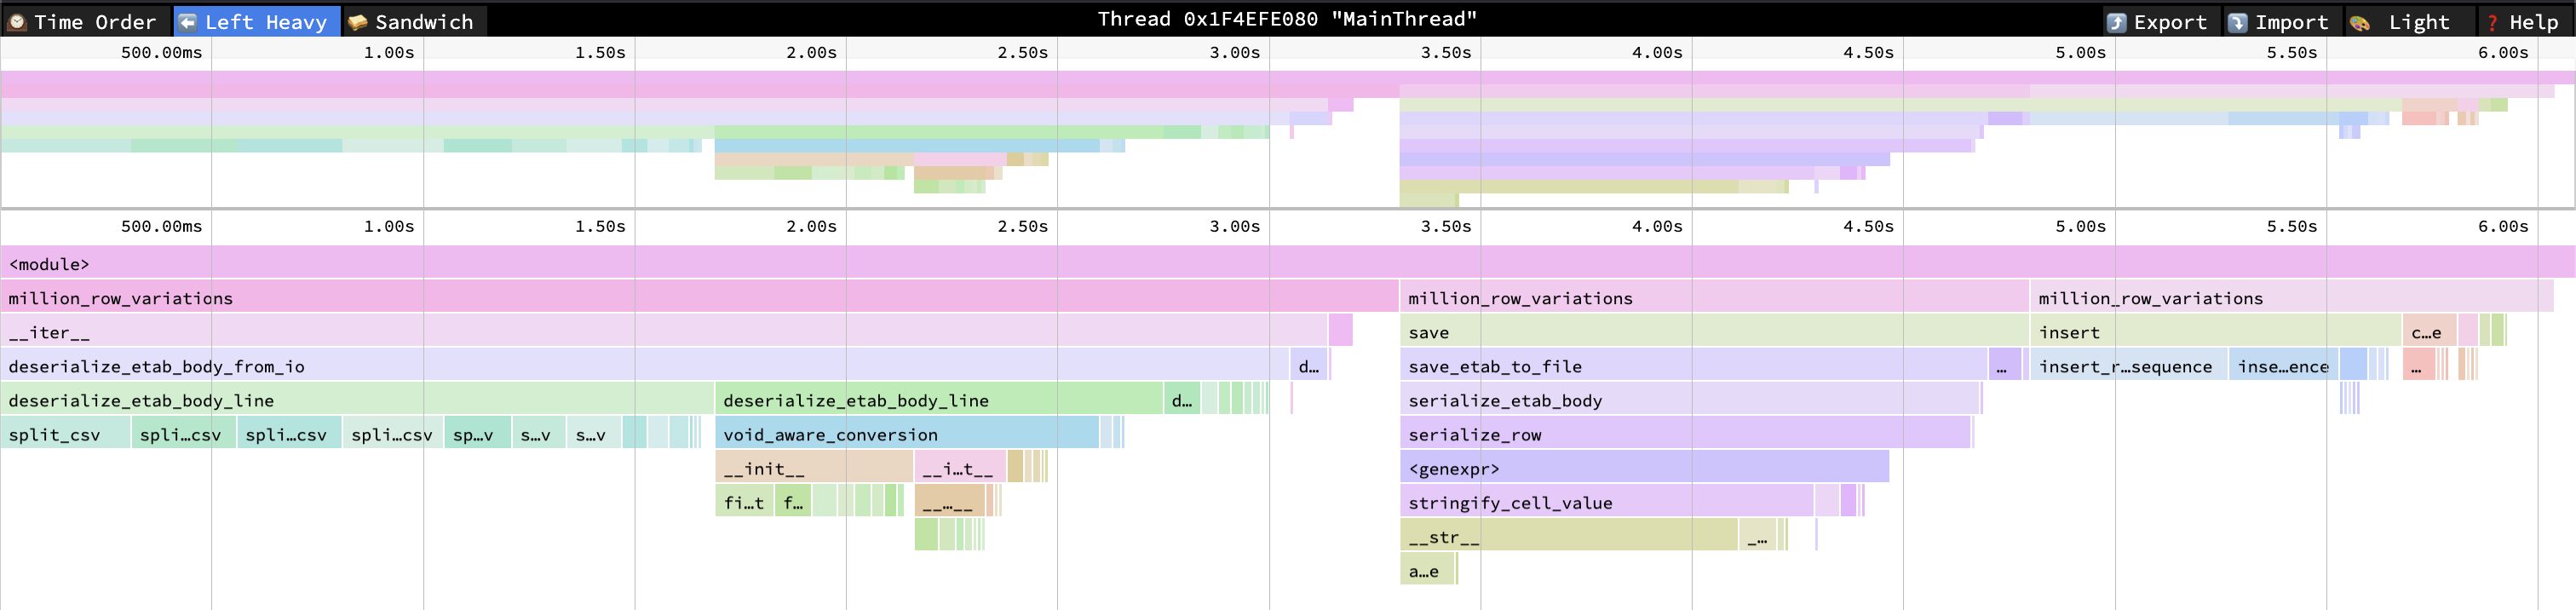
Profiles are tricky to read. I usually alternate between deterministic and sampling profiles to build understanding of where time is spent, but neither of them capture function call overhead or dereferencing overhead. At least not in a way that I understand. Yet I can tell from doing experiments that those overheads can add up very significantly in CPU-bound code. Below are functions sorted by number of calls, which can give an interesting alternative view.
| ncalls | tottime | percall | cumtime | percall | filename:lineno(function) |
|---|---|---|---|---|---|
| 66221532 | 2.956 | 4.464e-08 | 2.956 | 4.464e-08 | ~:0(<method 'append' of 'list' objects>) |
| 20000003 | 0.7724 | 3.862e-08 | 0.7724 | 3.862e-08 | ~:0(<built-in method builtins.isinstance>) |
| 12000029 | 0.421 | 3.508e-08 | 0.421 | 3.508e-08 | ~:0(<built-in method builtins.len>) |
| 10000051 | 0.5183 | 5.183e-08 | 0.5183 | 5.183e-08 | ~:0(<method 'strip' of 'str' objects>) |
| 6000000 | 0.7886 | 1.314e-07 | 4.106 | 6.844e-07 | ~:0(<method 'join' of 'str' objects>) |
| 6000000 | 0.5122 | 8.536e-08 | 3.318 | 5.53e-07 | etab_save.py:70(<genexpr>) |
| 5000000 | 0.8274 | 1.655e-07 | 2.88 | 5.761e-07 | etab_deserialize.py:69(void_aware_conversion) |
| 5000000 | 0.8188 | 1.638e-07 | 2.806 | 5.611e-07 | etab_save.py:73(stringify_cell_value) |
| 5000000 | 0.2071 | 4.142e-08 | 0.2071 | 4.142e-08 | etab_insert.py:61(value_fits_restriction) |
| 4000000 | 0.2286 | 5.714e-08 | 0.2286 | 5.714e-08 | ~:0(<method 'clear' of 'list' objects>) |
| 2001566 | 0.07241 | 3.618e-08 | 0.07241 | 3.618e-08 | ~:0(<method 'getrandbits' of '_random.Random' objects>) |
| 2000000 | 0.4007 | 2.003e-07 | 0.6012 | 3.006e-07 | carmtime.py:76(__init__) |
| 2000000 | 0.3725 | 1.862e-07 | 1.475 | 7.375e-07 | carmtime.py:18(__init__) |
| 2000000 | 0.1252 | 6.259e-08 | 0.1252 | 6.259e-08 | ~:0(<method 'upper' of 'str' objects>) |
| 1000006 | 0.1571 | 1.571e-07 | 0.1571 | 1.571e-07 | ~:0(<method 'write' of '_io.BufferedWriter' objects>) |
| 1000006 | 0.07397 | 7.397e-08 | 0.07397 | 7.397e-08 | ~:0(<method 'encode' of 'str' objects>) |
| 1000001 | 0.2161 | 2.161e-07 | 14.78 | 1.478e-05 | streaming_reader.py:46(__iter__) |
| 1000001 | 0.2158 | 2.158e-07 | 14.43 | 1.443e-05 | etab_load.py:46(deserialize_etab_body_from_io) |
| 1000001 | 0.1079 | 1.079e-07 | 4.014 | 4.014e-06 | etab_save.py:53(serialize_etab_body) |
| 1000000 | 5.346 | 5.346e-06 | 8.588 | 8.588e-06 | etab_deserialize.py:121(split_csv) |
The test is fully scripted. Except for installing system level dependencies such as compilers and pyenv, everything happens with a single command: building each Python version, creating each virtualenv, running the test and reporting the system description and results into a log file.
The MyPyC runs for 3.14 are not part of the script. Older mypy versions fail to compile (even though mypy --strict passes) and newer mypy versions don't run on the oldest Python versions, so I did that measurement as a one-off. From some casual comparisons, the mypyc compiled version seems to have gotten better with each recent Python release even when keeping the mypyc version constant. That perhaps warrants its own blog post?
All Pythons are built with pyenv using "PYTHON_CFLAGS='-march=native'
CONFIGURE_OPTS='--enable-optimizations --with-lto'". For 3.13 and 3.14
--enable-experimental-jit=yes-off was also added. 3.13 and 3.14 are built
with the respective required LLVM versions. This was straight-forward on Fedora
and MacOS (brew/dnf install llmv-18 and llvm-19), but required a bit of
trickery on RedHat9 as it doesn't support multiple LLVM-versions at same time.
Each test-sequence was run at least twice. In general the results are stable from run to run, which is in line with my expectations. The visualizer supports making intervals when there are many measurements for a single data-point, but since the intervals are very tight it doesn't really add any useful info; it just clutters up the view.